
4959K Microwave Analyzer
SKU : 4959K เครื่องวิเคราะห์สัญญาณไมโครเวฟ
Short Description
HANDHELD MICROWAVE ANALYZER
9KHz/300KHz – 54GHz
Product description
The Ceyear 4959K is a high-performance portable microwave analyzer that integrates a Spectrum Analyzer, Vector Network Analyzer (VNA), and Cable & Antenna Analyzer into a single compact platform. Covering frequencies up to 54 GHz, it provides accurate RF and microwave measurements for field and laboratory applications.
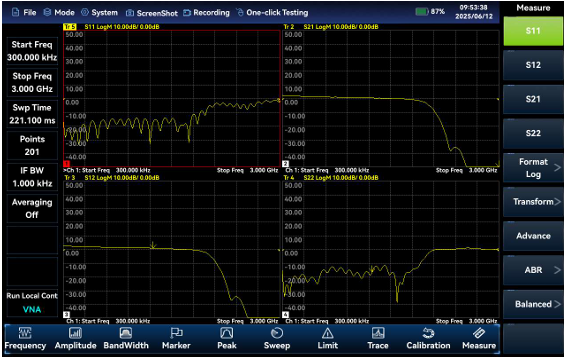
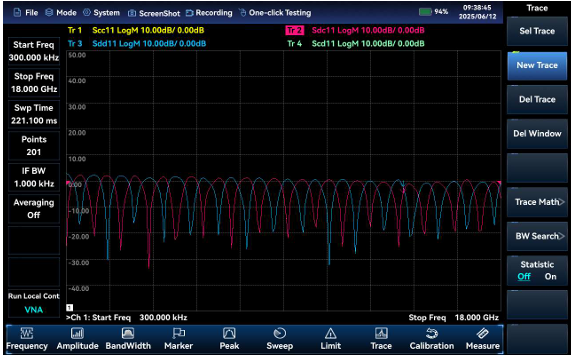
Vector network analyzer
The vector network analyzer of the 4959 series microwave analyzer is designed as standard with four S-parameter vector network analysis and measurement capability, supporting S-parameter testing of components such as amplifiers, filters, attenuators and duplexers, and mixed reflection Sparameter test, and also supporting display formats including log, linear, phase, group delay, Smith plot, polar coordinates, VSWR etc.
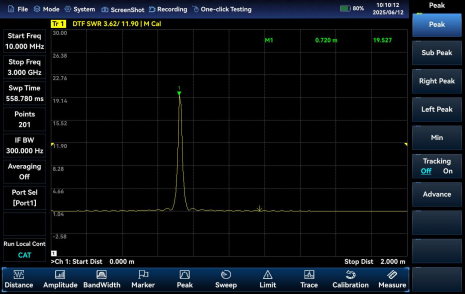
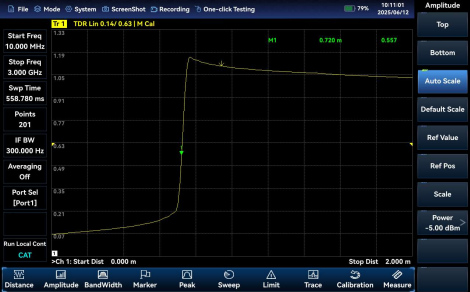
Antenna feeder analyzer (optional)
The antenna feeder analyzer of the 4959 series microwave analyzer supports measurement of return loss, VSWR, impedance, cable loss, and distance to faults of cables, feeders, and other DUTs, among which the measurement of return loss and distance to faults will help the user determine the specific causes of system performance degradation in the antenna feeder system. The antenna feeder analyzer supports TDR testing to analyze the types of cable faults. In addition, the instrument is also built in with some commonly used parameters of cables and feeders for ease of use.
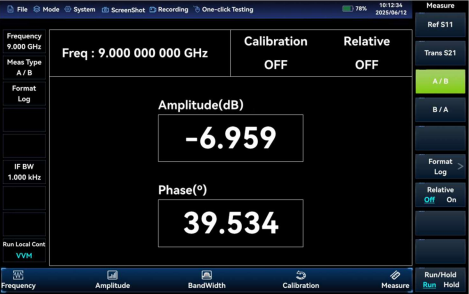
Vector voltmeter (option)
The vector voltmeter of the 4959 series microwave analyzer supports matching measurement ofelectrical length and phase shift of the DUTs, and also supports A/B and B/A measurement to measure the amplitude and phase consistency of the receiver.
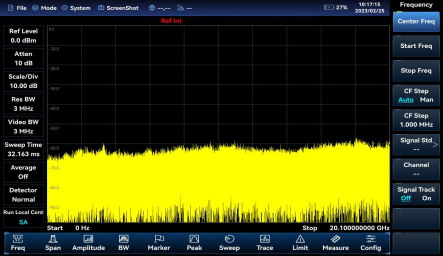
Spectrum analysis
The 4959 series microwave analyzer supports testing of channel power, occupied bandwidth,adjacent channel power, spectrum transmitter mask, carrier-to-noise ratio, audio demodulation,harmonic distortion, spectrum transmitter mask, multi-carrier adjacent channel power, and thirdorder cross-modulation as standard, and feature high sensitivity, fast sweep speed, large dynamicrange, and good phase noise index. The 4959 series microwave analyzer is built-in with multiple predefined signal standards that can be called up directly, and support noise marker and frequency counter, simultaneous display of 3 traces, multiple wave detector modes including Standard,Positive Peak, Negative Peak, Sampling, Average and RMS, as well as signal tracking and peak tracking function, and peak list function.
Interference analysis (option)
The interference analysis option includes a spectrum measurement, a waterfall chart, and an RSSI measurement function. The waterfall chart uses a three-dimensional display mode of frequency, amplitude, and time. You can easily observe periodic or intermittent signals in the waterfall chart. the color of the waterfall chart indicates the strength of the signal amplitude. The RSSI (Received Signal Strength Indicator) is mainly used to measure the intensity of a point frequency signal over time. Both the waterfall chart and the RSSI measurements support automatic signal storage.
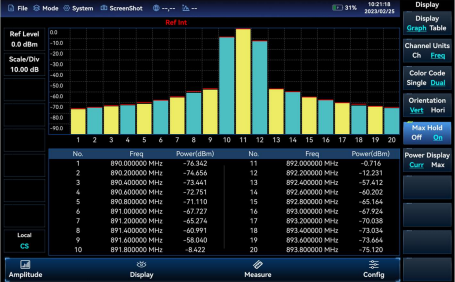
Channel sweep (option)
The channel scan measurement mode measures signal power on multiple channels. This power is displayed as either a bar graph or a list and can be measured for up to 20 channels. There are three measurement modes, depending on how the channels are set up: Channel Scan, Frequency Scan, and List Scan. All of these modes allow you to set the channel bandwidth and the number of channels
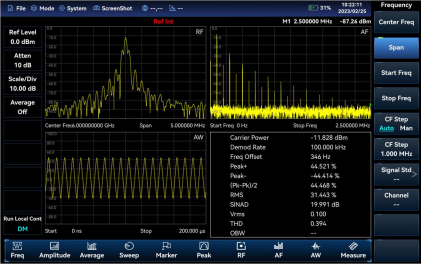
Analog demodulation analysis (option)
The demodulation analysis measurement mode displays AM, FM, and PM modulated signal plots and analyzes related parameters. The main plots and related parameters are measured as shown below.
RF spectrum: similar to the spectrum analysis mode, this plot displays the spectrogram of the modulated signal and allows for measurement of the occupied bandwidth.
Audio spectrum: displays the spectrogram of the demodulated audio signal.
Audio waveform: displays the waveform of the demodulated audio signal in the time domain.
Parameter Analysis: It measures and analyzes the carrier power, modulation rate, carrier frequency deviation, modulation depth (AM), modulation frequency deviation (FM), modulation phase deviation (PM), signal-to-noise ratio, modulation distortion, and total harmonic distortion of the modulated signal.
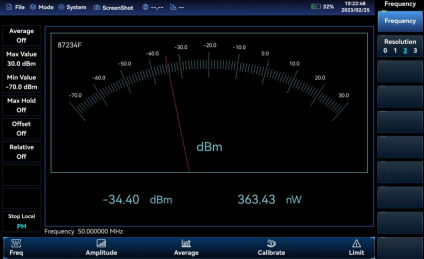
USB power measurement (option)
With the external USB power probe of the Ceyear 87230/87231/87232/87233 series, the USB power measurement function can be used to measure CW signal power of up to 40GHz.
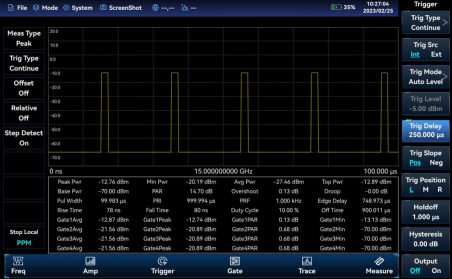
USB peak power measurement (option)
By connecting to the Ceyear 87234D/E/F/L USB peak power probe via the USB interface, this function can be used to test RF/microwave signals up to 67GHz, enabling pulse power measurement in a large dynamic range.
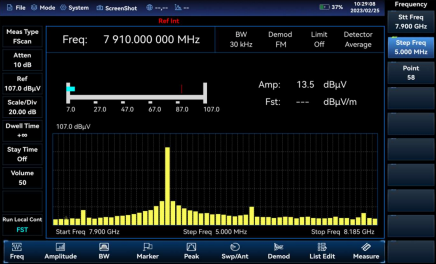
Field strength measurement (option)
The 4959 series microwave analyzer is equipped with a portable antenna for field strength measurement, space electromagnetic environment monitoring and radio management, in which users are allowed to call antenna files directly or customize antenna factors. Field strength measurement can be divided into three modes: point frequency measurement, frequency sweep measurement and list sweep measurement. Whereas, the point frequency measurement can be used to observe the frequency offset, amplitude value and field strength value of the current point by setting the point frequency rate. By setting the initial frequency, step frequency and sweep points, the amplitude and field strength changes in a frequency range can be observed. List sweep
measurements can be used to observe amplitude values and field strength values at list frequency points by calling a pre-edited or saved list.
measurements can be used to observe amplitude values and field strength values at list frequency points by calling a pre-edited or saved list.
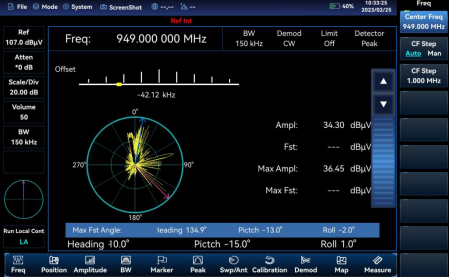
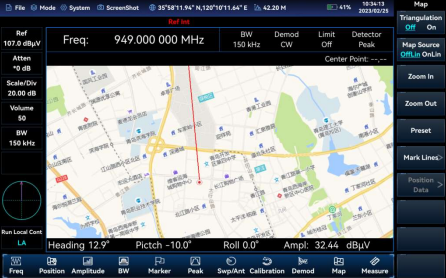
Location analyzer (option)
The location analyzer option shall be used together with directional antenna, e-compass and GPS/BDS for direct finding of interference signals, horizontal sweep & direction finding and map cross-location function. The ZE9080 series antenna and handle, if used, is built in with an e-compass, and thus it is not required to install one additionally.
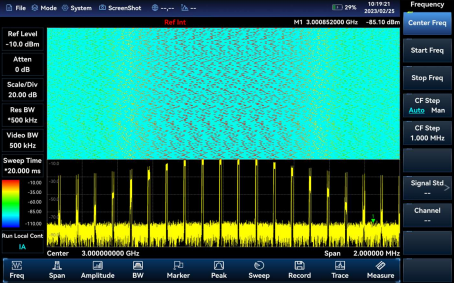
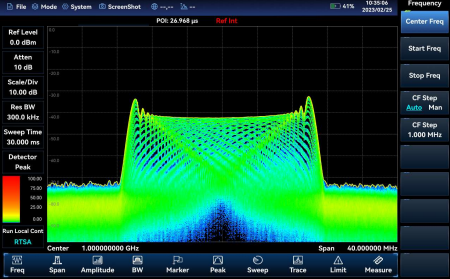
Real-time spectrum analyzer (option)
The real-time spectrum analysis function is mainly used for the capture and analysis of transient time-varying signals and burst signals. The real-time analysis bandwidth is up to 40MHz, which can realize the digital afterglow and waterfall plot measurement function of transient signals.
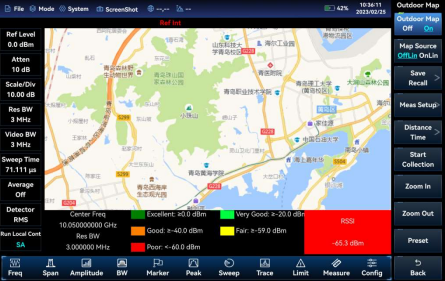
Outdoor map (option)
The outdoor map option, which is a measuring function in the spectrum analysis mode, can be use for RSSI testing and ACPR testing of interfering signals, and the test results can be marked on the map in real time according to time ordistance. The test results marked on the map can be saved to the instrument and can be called for later viewing.
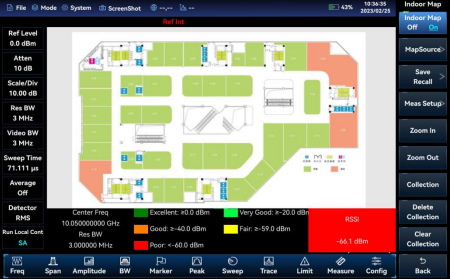
Indoor map (option)
The indoor map option can be used for RSSI test and ACPR test. Since the GPS signal cannot be received indoors, the user needs to manually move the position and mark the test results on the map. The test results marked on the map can be saved to the instrument and can be called for later viewing. Users can convert the plan in picture format into tile diagram and store it in the instrument through special software (presented with options).
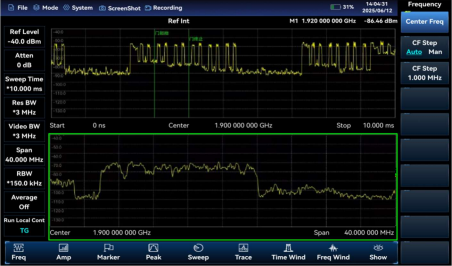
Time gate function (option)
Designed for interference detection of TDD signals, the time gate sweep function is divided into time domain window and frequency domain window. In the time domain window, the signal of a specific time period can be selected by setting [Gate Delay] and [Gate Width]. The frequency domain result of the selected signal will be displayed in the frequency domain window. The time gate sweep mode is zero sweep width state, with various parameter settings for distinguishing the uplink frame and the downlink frame in the TDD signal in the time domain; By setting [Gate Delay]and[Gate Width], you can select the uplink signal, so as to achieve the effect of "filtering" the downlink signal (downlink signal will have an impact on the search of interference signals).
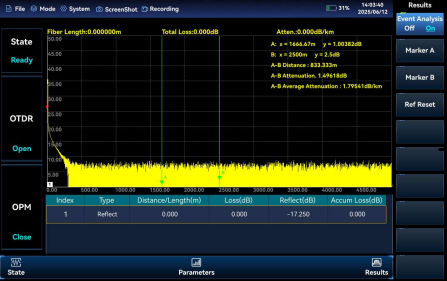
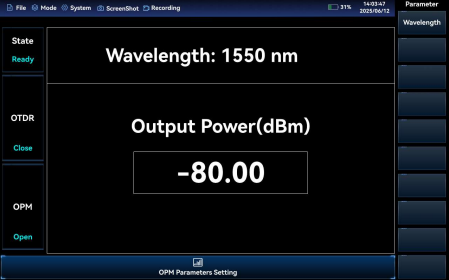
Optical time domain reflectometer(option)
The optical time-domain reflectometer of the 4959B/D/E/G/H/K microwave analyzer, when being used together with an external USB optical time-domain reflectometer, can achieve locating and analysis of optical fiber fault, as well as optical power measurement.


Powered By
 MakeWebEasy